

- Home
- »
- Products and Solutions
- »
- Software
- »
- PIM WebOffice
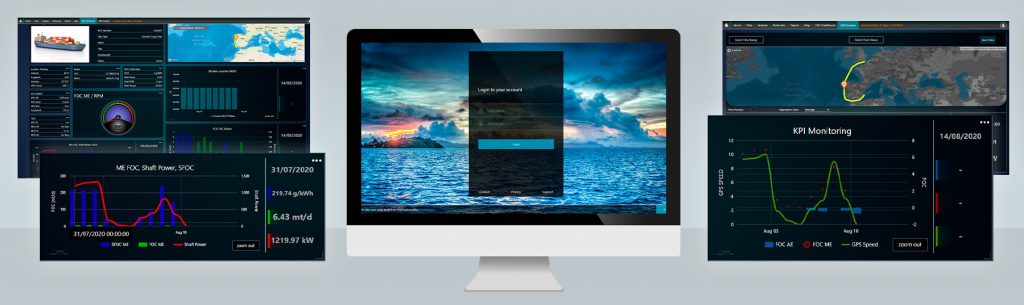
LIVE VESSEL PERFORMANCE MONITORING with VEINLAND’s PIM WebOffice
Simplified, customizable browser-based
Ship owners, captains or crew members can obtain a general overview of the vessel information as well as a detailed report or analysis of its current performance by using the browser-based PIM WebOffice.
Only an internet browser and basic internet connection are required.
- Available for offshore or onboard crews
- Interactive and clearer view on map, diagrams and charts
- Browser-based, installation no longer necessary
- Most recent vessel position and accumulated vessel data
- Software updates done on server automatically, with latest features
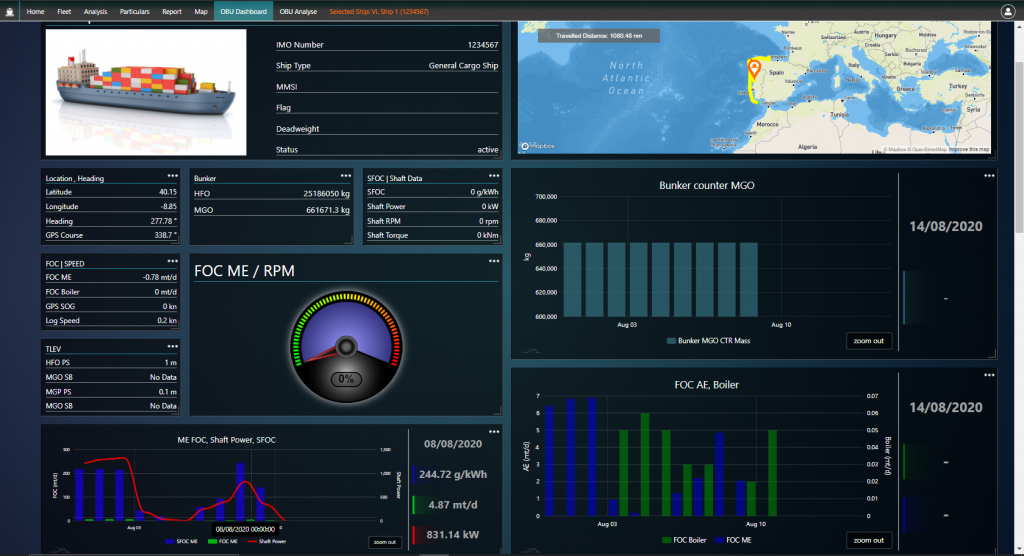
Find out the performance of your vessel and its latest position
Signals collected via new or existing sensors, flowmeters, GPS,
inclinometer and other devices onboard can be displayed on the
PIM WebOffice Dashboard for further analysis and evaluation. Typical
but useful information such as live position, course, vessel speed,
GPS coordinates, Fuel Oil Consumption (FOC), flow counter,
engine and shaft power meter can easily be seen. Crew members
onboard and ship managers offshore are also able to estimate the upcoming voyage information- current distance to the next port,
ETA as well as information of the previous journey. All of the
information will be helpful when setting KPI, continuous performance monitoring and (noon) reports.
Live Online Presentation
Get to know VEINLAND’s WebOffice in a live presentation.
We’ll show you all the functions you need to monitor the performance of your ships.
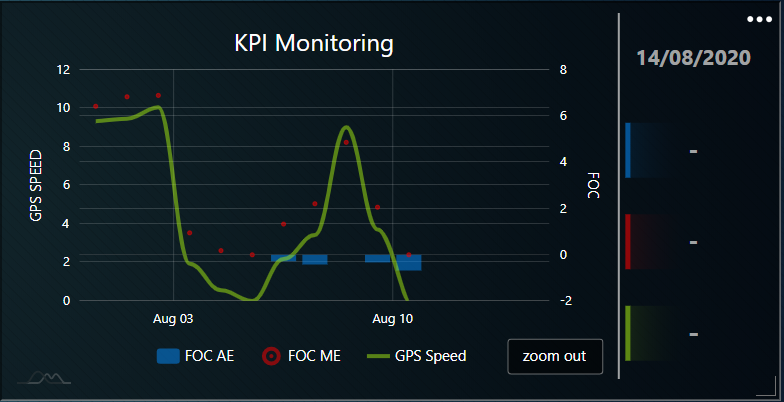
Detailed, highly configurable analysis
Select a period you’d like to view the data of the vessel collected from
various sensors and flowmeter. Feel free to drag and drop, configure the layout of the displayed data and report.
- Freely defined time range
- Data can be easily selected from the library according to clients’ needs
- Highly configurable chart types- i.e. line chart, bar chart or point graphs
- Average values & exact value at a particular time can be chosen and displayed
- Data can be viewed on the Dashboard or a PDF report can be generated for further analysis
- Additional useful function: A report can also automatically be generated immediately right after bunkering. This can be viewed on the dashboard or sent to ship owner’s or manager’s via Email.
Request a Callback
You have questions or need further information?
Let us know when we can reach you best by telephone.
One of our experts will be in touch with you shortly.