

- Home
- »
- Products and Solutions
- »
- Software
- »
- Live Demo PIM WebOffice
Wish to know how such a tool can improve your fleet’s performance?
Let us show you a LIVE DEMO! Request here!
Well-trimmed Fleet for Highest Performance & Efficiency
The maritime industry is facing various radical changes over the past 10 years.
Vessel performance monitoring tool is one of the most useful instruments developed to ensure that vessels are operated in the most efficient way possible- in terms of cost, time and fuel consumption.
Research has shown that a well-trimmed vessel contributes significantly to cost and energy savings.
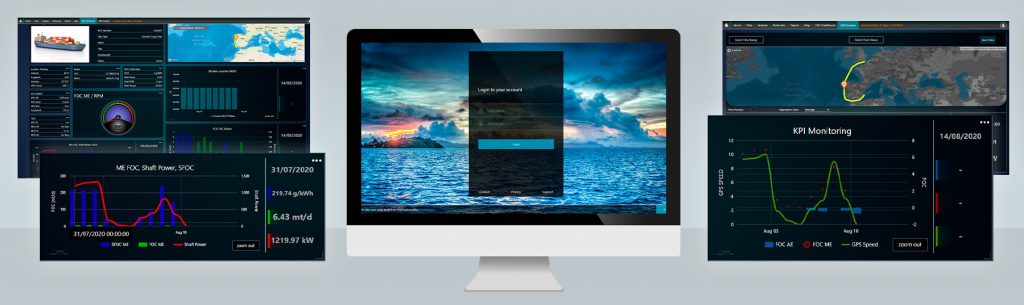
As an extension to the existing Performance Indicator Monitor-Onboard Unit (PIM-OBU), VEINLAND’s PIM WebOffice makes vessel monitoring simpler and more convenient by displaying and sending useful data of the vessels to shipowners, ship operators and fleet managers for further analysis.
At the same time, ship captains and crew members are able to monitor this information collected live onboard using the existing OBU- Onboard Unit.
Key highlights of VEINLAND’s PIM WebOffice:
- Simplified & browser-based
- Dashboard with simplified overview for shipowners and fleet managers
- Detailed report of current performance
- REST-API function eases data handling
- No additional software required- works well with just an internet browser
- Automatic Bunker Report & Reliable data for further analysis
- A report will be generated and sent to ship managers automatically after bunkering- with data on mass, volume and density of MGO / HFO before and after, CTR values and GPS position in tables or interactive charts and maps
- Other useful signals collected from sensors and flowmeters onboard
- Most recent position, course, speed, GPS coordinates, FOC, flow counter and information of engines and shaft power meter
- Highly Customizable for easier comparison
- Easily select voyages or vessels to compare using Voyage Editor function
- Freely defined time range & chart types for data visualization
- Dashboard view or PDF reports available